
Just like that, another year goes by. In our case, as we continue to catalog our experiences with an as-of-yet unnamed case study domain and monetize our content there through Ezoic display ads, it’s had (many) ups and downs. If you’ve been keeping up with our month-by-month reports (which you can also check out through that handy Revenue Reports tab up there), you’ll probably know how it went.
TL;DR, or just to cap off our final thoughts and round-up for the year, let’s take a look back at 2022 from January to December. By December (and leading into January 2023), pageviews for our case study site are right where they began back in January, which is a bit disappointing. We started the year strong with about 9,000 daily pageviews in January. By Christmas of 2022, our pageviews dropped back to 9,000.
It’s a downer, given that our case study domain peaked by the middle of the year. Back then, the daily site traffic was in the 20,000s and higher. In short, it was going well until a Google Core algorithm update for their popular search engine dropped in around September. That one update (one of many that came later) essentially nerfed our case study domain, ranking it lower in the Google search results.
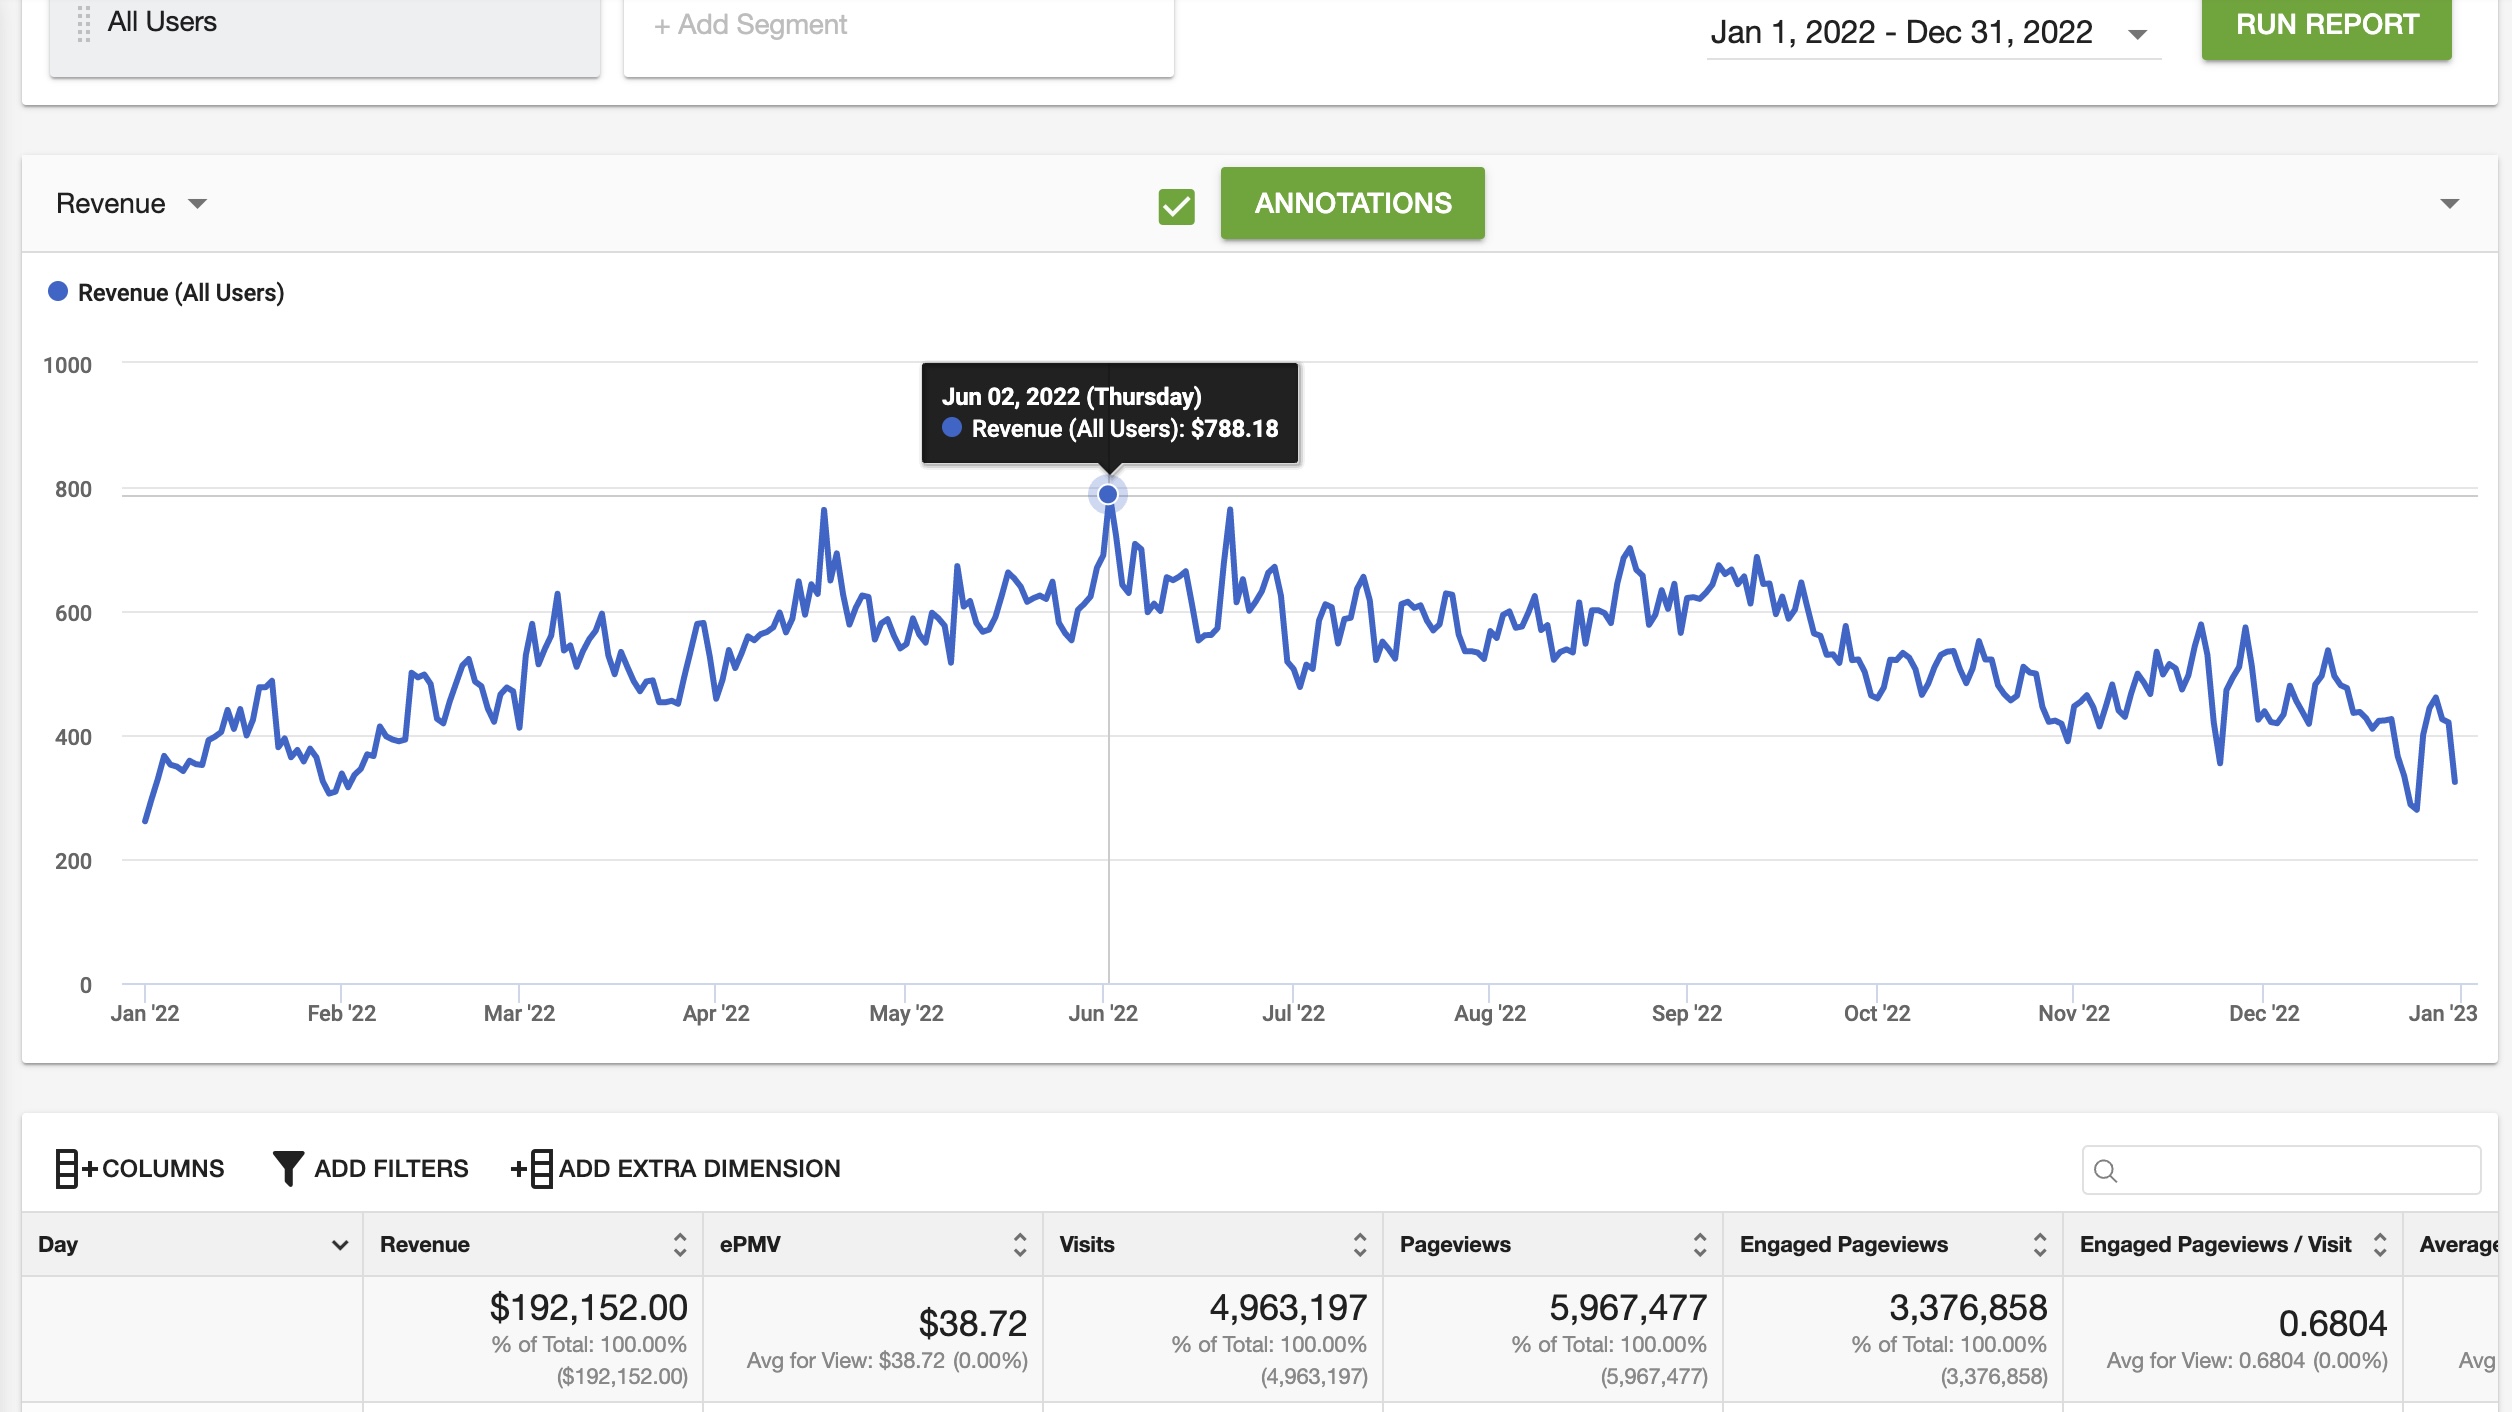
Of course, without as much visibility on the first page of Google, that led to lower traffic, in general. Thus, Q4 (fourth quarter) of 2022 recorded dismal site traffic (not to mention ad revenues). Still, for the whole of 2022, our case study domain attracted over 4,963,000 visits, more than 5,967,000 pageviews, as well as nearly 3,377,000 ‘engaged’ pageviews. It’s more than any other year, so 2022’s not that bad.

How Much Ad Revenue Did We Earn? Over $192,000.00
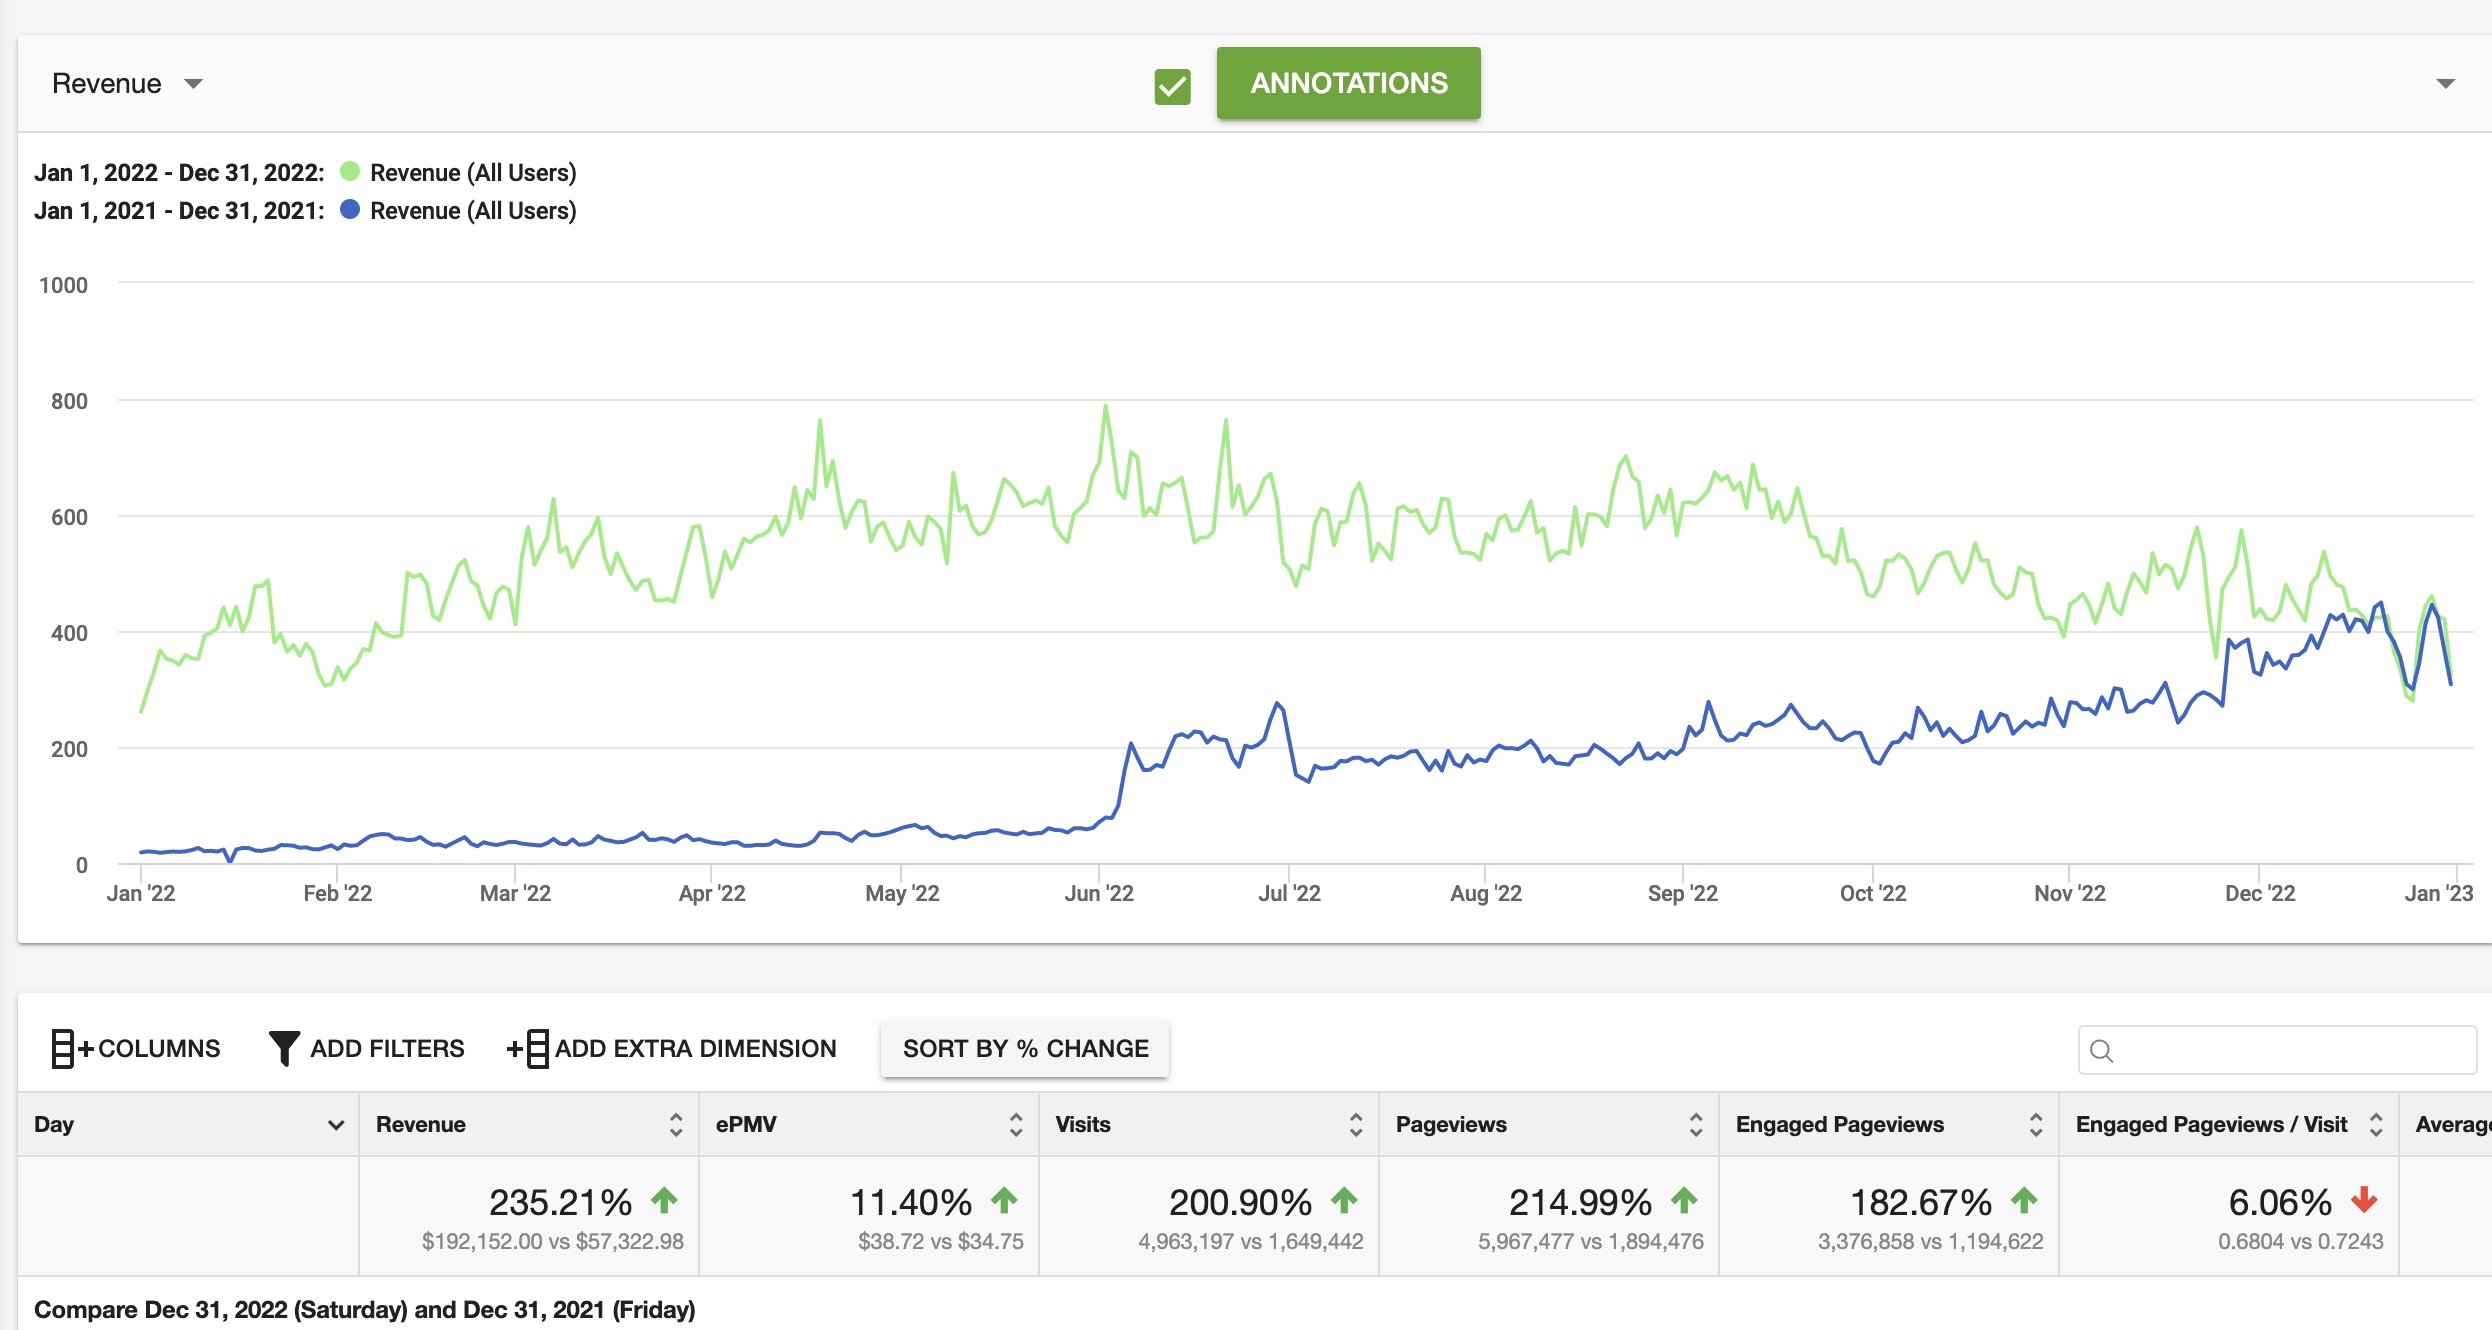
Percentage-wise, this meant a roughly 200%, 215%, and (nearly) 183% increase in visits, pageviews, and engaged pageviews, respectively, when comparing 2021 and 2022. Again, pretty good results all around. All in all, that yielded a total ad revenue from display advertising of around $192,000 for our case study domain.
On top of that, our EPMVs (earnings per thousand visitors) were also relatively consistent throughout the year, at about $38.00. Some of the better months did yield higher average EPMVs, in the $40s. You might also notice (explained in the video below) how our daily EPMVs varied quite significantly. Some of the best days can net EPMVs in the $50s range, though it’s just as seldom as those times when it crashed down to $25.
We had hoped for more, but a 235% year-on-year (between 2021 and 2022) improvement in ad revenues isn’t something to scoff at. So, if you’re keen on testing our strategy for making money online from content creation, check out our guide to learn more. But in the meantime, we then documented a decline in daily ad revenues, coinciding with the lower site traffic and monthly ad revenues (more on those in a bit).
That’s especially so by the tail-end of 2022. Some of our best days in 2022 saw us earning nearly $800 in ad revenues within a single 24-hour period from just one site that’s running display advertising. We then had many other days when daily ad revenues were in the $600s and $700s range. Yet, these figures had declined by the fourth quarter of 2022. So, what exactly happened that caused it to be this way?

Why Is Our Ad Revenue Declining?
Well, it wasn’t just the Google Core algorithm update that played a huge role in our case study domain’s ad revenues seeing a downward trend. In fact, our ad earnings (both daily and monthly) closely echo the Ezoic Ad Revenue Index. The latter is basically a forecast for ad revenues that you, as a publisher, might expect, depending on the ad dollars being spent by advertisers to promote their goods or services.
In essence, it’s a measure of advertisers’ ad spending capacity… Publishers would usually earn more if the advertisers are willing to put more money on the table. It isn’t just applicable to Ezoic either, as this index will be applicable to other ad networks as well, such as Mediavine, AdThrive, and so on. When looking at historical data, this very index should have shown an increase or spike by the end of the year.
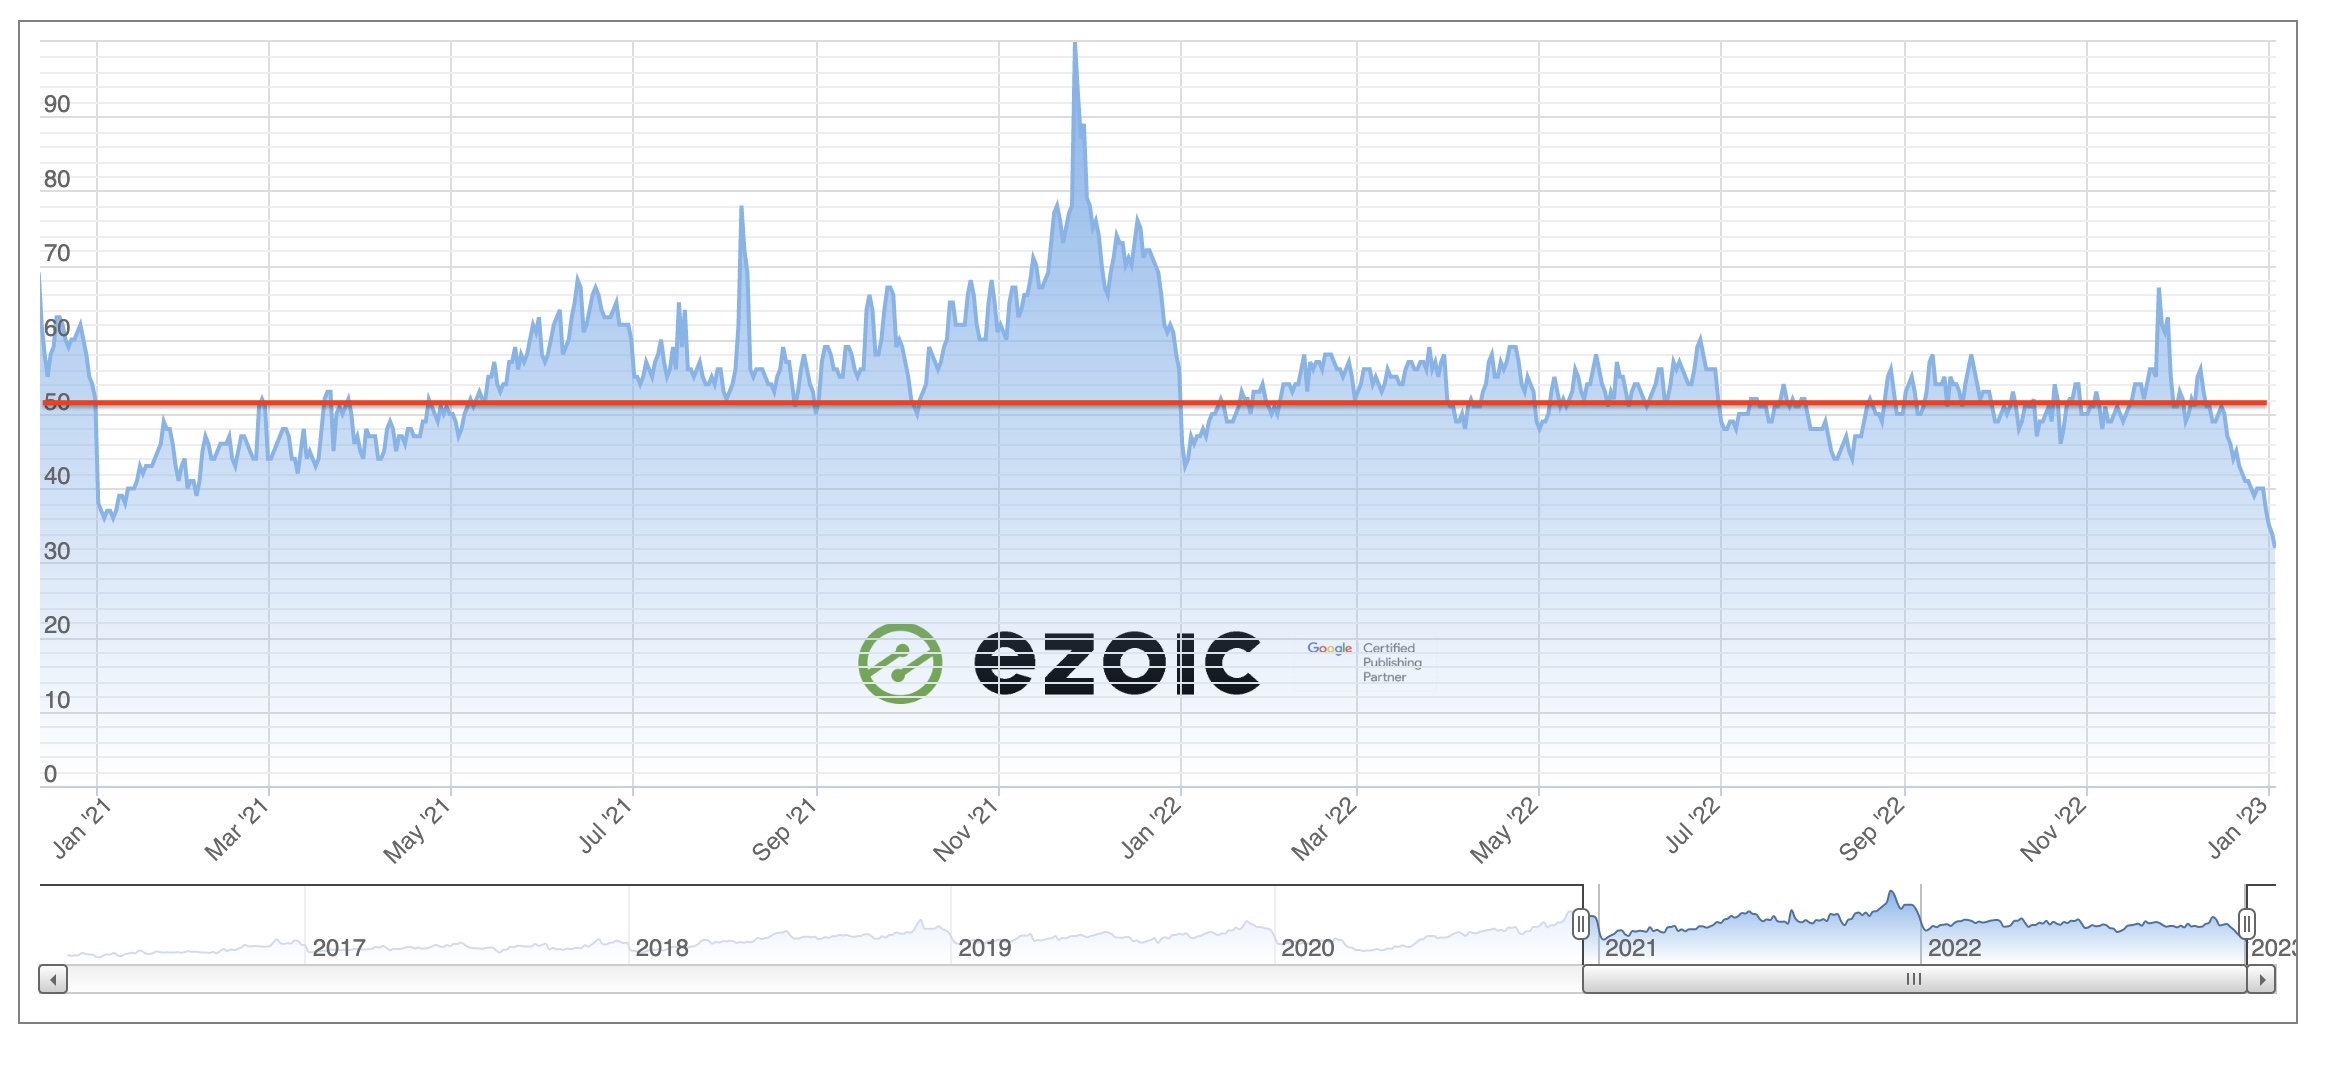 Typically, there’s more ad spending by the fourth quarter and particularly by the end of the year, as most advertisers are busy prepping for the holiday seasons. Yet, this scenario never happened this year, as you can see in the index (down below). Display ad spending in 2022 has been pretty flat all year round when you compare it against the red reference line, which tracks the index from January 2021 to 2023.
A quick peek at this index also shows how there’s a huge spike in December 2021, yet it’s been flat for the majority of 2022, including December. The only small spike occurred not too long ago during Black Friday, but that’s about it. This can be attributed to many factors, mostly the economic downturn as well as a recession in some countries. As such, we can say that 2022’s been a bit of an odd year.
How Did We Earn Our Ad Revenues?
If you’re new here, you may also be curious about how we’re earning these ad revenues, besides the fact that we’re monetizing our case study domain with Ezoic. Well, most of our income was earned through display advertising. Essentially, putting ad banners on a blog site (we’ll discuss more about our content in just a minute). However, we did try to diversify this by the latter parts of 2022.
Since then, we began experimenting with showing ads in videos that we then embed onto our case study domain. Therefore, these videos accompany our long-form, SEO-focused, keyword-research articles. The videos themselves are hosted on Ezoic and are monetized with Ezoic, too. It’s sort of like YouTube. Those videos netted us an additional $4,000 to $5,000 in ad revenues, with the $192,000 from display ads.
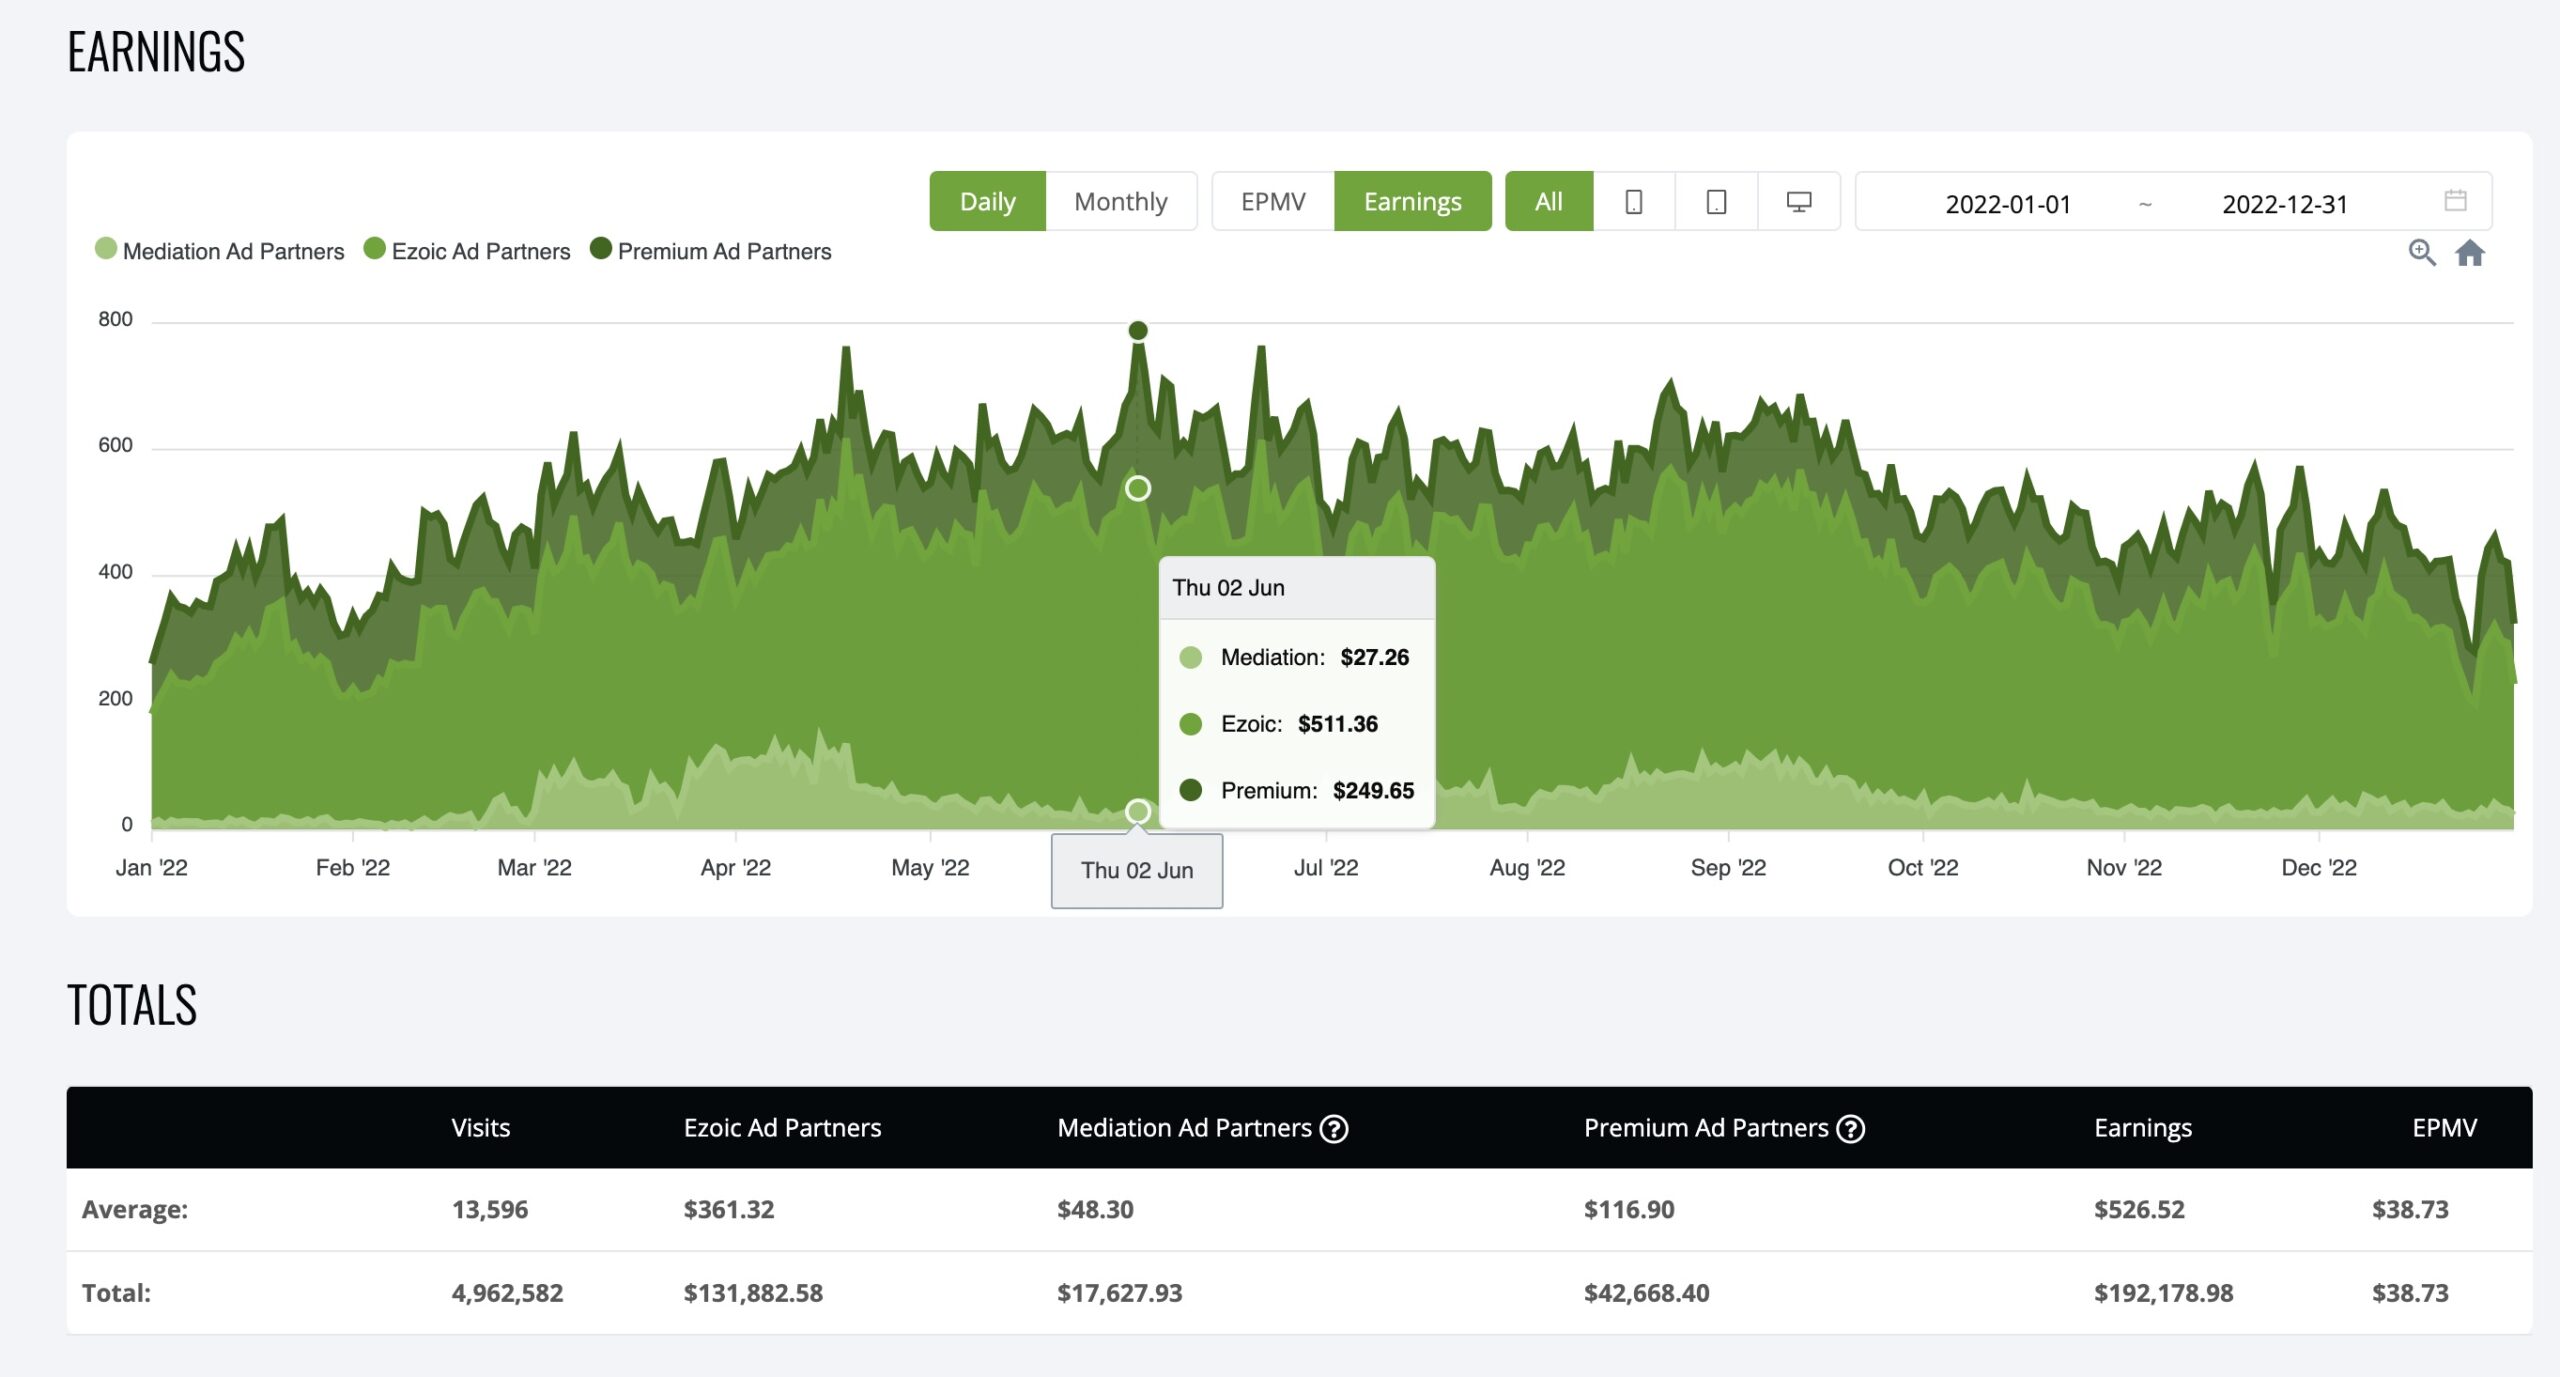 That’s a healthy figure, given that we’re just getting started with it. Meanwhile, the $192,000 could then be split up into numerous other sources. Most of it, about $132,000, came from Ezoic’s ad partners, while nearly $43,000 came from Ezoic’s premium advertisers. The latter does require you to sign up with Ezoic and their Premium program beforehand, though. Then, there’s another $18,000 from ad mediation.
‘Mediation’ is what enables us to monetize our case study domain with other ad networks besides Ezoic. For those who are unsure of how this works… Ezoic’s ad placeholders on a webpage would swap Ezoic’s ads with those from, for example, Google’s AdSense, if Ezoic finds that AdSense can earn you more than its own ads. However, this doesn’t yet take into account the premium fees that we have to pay to Ezoic.
Premium Program How Much Does Ezoic Cost Us?
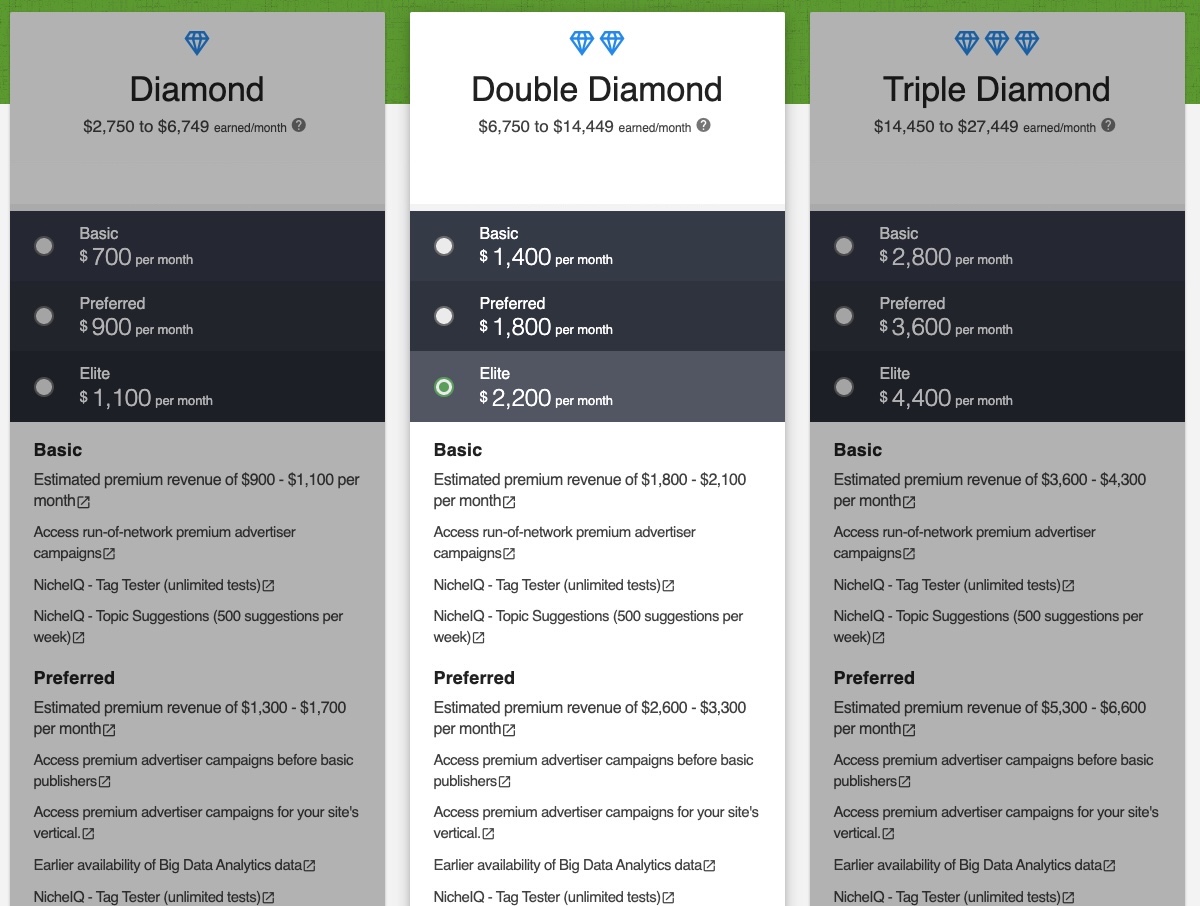
Now, to be a part of their Premium program, you have to pay upfront every month. In our case, we have been paying Ezoic $2,200 at the start of each month. So, that’s $26,400 for the entirety of 2022. This has got to be one of the most critical downsides to joining their Premium program. We may even argue that their pricing model may squeeze publishers a bit too hard at times. Still, we think it’s worth it.
For starters, Ezoic guarantees that you’re always earning more in return for having premium advertisers put display ads on your site than what you’re paying. The proof of that net profit is in the pudding, as we paid $26,400, and earned around $42,600 in return, as we detailed earlier. It’s just as worthwhile as that AdSense mediation, which doesn’t cost us anything in terms of fees, as it’s just a feature that you turn on or off.
 Although, mediation earnings are paid through Google, not Ezoic. If you’re still wondering, you might as well leave this system turned on, as it ought to yield you higher ad revenues through its optimization. Otherwise, without mediation or premium advertisers, our case study domain would’ve charted slimmer ad revenues for the whole of 2022 than what we’re currently experiencing right now.
Previously, our case study domain was even approved for monetization with AdThrive. Yet, although we compared Ezoic vs Mediavine vs AdThrive as well, the three giants of ad network providers, we’re still sticking with Ezoic. No doubt, it’s perhaps the best of the best ad networks for our use case, especially so with their Ezoic ad revenue guarantee for new publishers, so you’ll be seeing more of Ezoic in 2023.
Is Our Content Making Us A Profit?
While we’re here, we may as well be forthcoming about how much we’re spending behind the scenes, as well. Thus far, we’ve invested a lot of money into our content, and we’ve since ramped it up significantly in 2022. Realistically, we spent around $60,000 in 2022 for content alone. That goes to paying our team of writers, getting each article edited and published, in addition to keyword research.
The latter is something we’ve covered in detail many times before, and we can’t stress enough just how crucial it is to get right. In the past, we’ve gone through our tips and tricks for how to do some keyword research. Not to mention, setting up a simple on-page SEO checklist to make sure that you’re always on top of trying to game Google’s search engine. Granted, this process doesn’t have to be expensive.
We’ve since listed some free keyword research tools that you too can use. Plus, we’ve made a deep dive into what is NicheIQ, which is Ezoic’s keyword research tool. If you’re already in the Ezoic ecosystem, you may as well make good use of it, right? Overall, it’s what allows us to ultimately publish relevant, engaging, and insightful long-form content… Which we could then monetize with display advertising.
Last but not least, we have to take into account the money being spent elsewhere, too. We need to keep our case study domain online, pay for server hosting and Ahrefs licences, and so forth. Yet, profits for 2022 for our case study domain are still pretty good, even if we wish that it could’ve yielded more in the end. A vital strategy for us is ensuring that all of our articles aren’t just one-and-done investments.
| Month (2022) | Total Monthly Earnings ($) | Total Monthly Page Visits | Total Monthly Pageviews | Total Monthly Engaged Pageviews | Average Monthly EPMV ($) |
|---|---|---|---|---|---|
| January 2022 | $11,663 | 339,313 | 389,738 | 240,188 | $34.37 |
| February 2022 | $12,087 | 341,089 | 391,128 | 240,440 | $35.44 |
| March 2022 | $16,136 | 400,022 | 458,979 | 278,879 | $40.34 |
| April 2022 | $17,585 | 437,153 | 514,648 | 292,088 | $40.23 |
| May 2022 | $18,637 | 475,553 | 566,450 | 314,912 | $39.19 |
| June 2022 | $19,199 | 455,218 | 559,644 | 299,271 | $42.18 |
| July 2022 | $17,609 | 488,689 | 604,283 | 326,642 | $36.03 |
| August 2022 | $18,476 | 504,074 | 614,438 | 343,568 | $36.65 |
| September 2022 | $17,963 | 451,257 | 549,607 | 307,241 | $39.81 |
| October 2022 | $15,155 | 387,408 | 475,004 | 262,370 | $39.12 |
| November 2022 | $14,319 | 350,986 | 431,359 | 238,321 | $40.92 |
| December 2022 | $13,188 | 333,577 | 413,774 | 233,338 | $39.54 |
What Plans Do We Have For Our Content?
Simply put, those articles that we’ve spent a lot of money, time, brainpower, and energy creating aren’t going to lose value in mere weeks. Rather, they’ll continue ranking and netting us ad revenues for years and years to come (hopefully). So, even if a particular article or blog post is only earning us $10 each month, across the span of at least 2 to 3 years, the net earnings will outweigh the expenses put into it.
In the end, it’ll work out well for us, anyways. Plus, we currently have over 2,100 of these articles in our case study domain, continually accruing future earnings. Furthermore, we’ve planned on expanding this already-extensive catalog of writings and publishing at least 100+ more keyword-research, SEO-focused articles each month moving forward. It’s been picking up the pace pretty well lately.
Elsewhere, we also plan on refreshing those older, already-published articles to keep them up to date. In addition, we’re going to make slight tweaks and optimizations to our strategy in renewing these articles over time. In the near future, there are, unfortunately, some things that we, as publishers, can’t so easily change or influence. Those Google Core search algorithm updates are one such example.
We can only hope that Google will put out changes that will, once again, be in our favor and rank our case study domain more competitively to bring more organic traffic. Moreover, we also have to consider the state of the global economy and financial markets. If deep-pocketed advertisers are conservative on investing in display ads for 2023, we’re probably going to see revenue growth plateauing next year, too.
Closing Thoughts
Nonetheless, there are other aspects that we can certainly improve upon for 2023. For instance, we have to be more cognizant of maximizing the amount of traffic that we could pull by optimizing all the content that we already have. In other words, it’s all about maximising SEO and traffic from those articles. But for the most part, patience is key. A new article, no matter how good it might be, will take months on end to begin ranking.
And only then will it begin picking up organic traffic, before you’ll finally notice its return on investment. In our experience, the fruits of our labor aren’t necessarily certain. Not every article or piece of content is going to be successful… Some will win, and some will lose. At the end of the day, you’ll need to be persistent, put out something new, unique, and interesting, and see what works and doesn’t.
So, for the best possible chances of making it, be sure to check out our guides on how to get started with Ezoic. As well as, how to optimize Ezoic for maximum ad revenue. Or, if you’re still unsure and want more details, leave a question in our Ask Me Anything section, and we’ll try to answer as earnestly as we can. We also have this neat video down here, summarising everything that we’ve discussed so far…

